Introduction
I started this project after one too many debugging sessions where I had Cloudflare open in one tab and Grafana in another, trying to line up timestamps by eye.
It worked, technically.
It was also slow, frustrating, and easy to get wrong under pressure.
What I really wanted was one place where edge traffic and my internal metrics lived on the same timeline. If traffic spikes while conversion drops, I want to see that relationship immediately. If request volume climbs but unique visitors stay flat, I want that pattern right beside cache behavior, backend latency, and error rate.
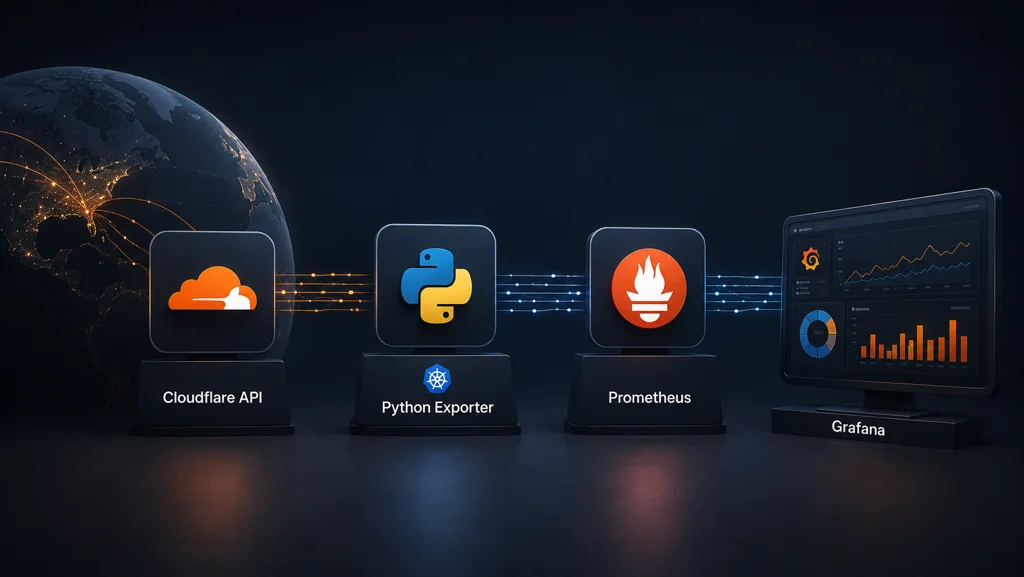
This series is my practical path to get there in production with a Python exporter, Prometheus, and Grafana.
Part 1 is the foundation: architecture and metric semantics. In my experience, if this part is fuzzy, the dashboards may look polished but still push you toward the wrong conclusions.
What this article covers
- The data path from Cloudflare GraphQL to Prometheus
- Why this exporter emits windowed gauges
- How to interpret
requestsandunique visitorssafely- The labels and timestamps that make overlap analysis possible
- Common mistakes that create false conclusions in Grafana
Why Not Just Use Cloudflare Analytics UI?
Cloudflare’s analytics UI is useful, and I still use it.
The problem starts when you want correlation with internal metrics:
- API response times
- error rates
- conversion events
- queue lag
- deployment markers
- feature flag rollouts
But when I’m investigating regressions, I need correlation speed, not tab-hopping. Manually comparing timestamps across tools gets old fast, especially during incidents.
A Prometheus-native path gives one query surface and one timeline. That is the main objective.
Architecture in One Flow
flowchart LR
  CF["Cloudflare GraphQL API"] --> EXP["Python Exporter"]
  EXP --> CACHE["SQLite Cache"]
  EXP --> METRICS["Metrics Endpoint (/metrics)"]
  METRICS --> PROM["Prometheus Scrape"]
  APP["Custom App Metrics"] --> PROMTAIL["Promtail"]
  PROMTAIL --> GRAFANA["Grafana Dashboard"]
  PROM --> GRAFANA["Grafana Dashboard"]
I kept the pipeline intentionally simple:
- The exporter calls Cloudflare GraphQL for a completed bucket.
- It persists bucket data to SQLite for durability.
- It exposes current and replayed metric samples on
/metrics. - Prometheus scrapes on schedule and stores samples.
- Grafana queries Prometheus and overlays Cloudflare with internal metrics.
The exporter is doing more than API translation. It normalizes Cloudflare’s bucketed output into something Prometheus can scrape consistently and that I can reason about later when things break at inconvenient times.
Bucketed Data Changes How You Think About Metrics
Cloudflare analytics is fundamentally bucketed by time windows.
If your dataset is httpRequests1hGroups, each value represents one hour of aggregated behavior. Even if Prometheus scrapes every minute, the logical unit is still that hourly bucket.
That has two immediate consequences:
- Scrape cadence and data resolution are related but not identical.
- Query semantics must respect bucket meaning.
I learned this the hard way: you can build a beautiful dashboard that is still mathematically wrong if you ignore bucket semantics.
Why These Metrics Are Gauges
Key metrics:
cloudflare_zone_requestscloudflare_zone_unique_visitors
These are emitted as gauges because each sample is the value of a specific completed window, not a single monotonic counter stream originating in the exporter process.
Think of each sample as a snapshot of a bucket result, not a counter tick.
If you treat these as native monotonic counters and apply counter-centric assumptions blindly, you get incorrect interpretation.
Label Design Is Part of Data Contract
The two labels that matter most for Cloudflare series are:
zone_idwindow_seconds
zone_id scopes the series to the site/zone.
window_seconds preserves resolution context over time. This is critical when you later switch from hourly to minute-level datasets, compare environments, or revisit older screenshots where panel settings are gone.
A metric without resolution context is easy to misuse.
Delayed Collection Is a Feature, Not a Bug
Cloudflare aggregation is not always immediately complete at wall-clock boundaries.
A short delay (for example CF_DELAY_SECONDS) avoids collecting a still-settling bucket and then changing the value repeatedly as late-arriving counts appear.
That design choice supports two goals:
- bucket stability in Prometheus
- cleaner time series for dashboard interpretation
Without delay, the charts can look more "live" while being less trustworthy, which is a trade-off I do not want in production.
Stable Buckets Improve Query Reliability
Once a completed bucket is first collected, the exporter keeps that bucket’s represented value stable in the primary series behavior. This prevents churn for the same logical window and makes historical comparisons cleaner.
That sounds subtle, but it matters a lot:
- alert baselines are less noisy
- annotations align better with actual behavior
- replay and backfill become safer
In short, we prioritize stable historical truth over hyper-reactive but unstable intermediate values.
The Most Important Caveat: Unique Visitors
cloudflare_zone_unique_visitors is unique per bucket.
It is not globally unique across arbitrary long ranges.
This is the interpretation mistake I see most often, and I made it myself early on.
If you sum hourly unique visitors across a day and call that "daily unique visitors," you can overcount heavily because the same person may appear in many buckets.
Safe uses:
- compare uniques and requests in aligned buckets
- analyze trend direction
- inspect requests-per-unique ratio over time
- detect structural traffic pattern shifts
Unsafe uses:
- treating bucketed uniques as additive audience totals
- presenting bucket-summed uniques as business KPI truth
Why Requests + Uniques Overlap Is So Useful
Overlaying requests and unique visitors is simple but surprisingly informative.
Patterns you can detect quickly:
requestsrising much faster thanuniques: more repeat hits per visitor, bots, crawl bursts, cache behavior shifts, or client retry stormsuniquesrising with flat requests: broader reach with lighter per-user activity- both rising together: genuine traffic growth events
I do not treat this panel as a root-cause oracle. I treat it as a fast signal detector: when the shape changes, I immediately pivot to nearby system and business metrics.
PromQL Starter Queries
Use these as baseline panels:
cloudflare_zone_requests{zone_id="<your-zone-id>"}
cloudflare_zone_unique_visitors{zone_id="<your-zone-id>"}
Requests-per-unique ratio:
cloudflare_zone_requests{zone_id="<your-zone-id>"}
/
clamp_min(cloudflare_zone_unique_visitors{zone_id="<your-zone-id>"}, 1)
Optional smoothing for noisy views:
avg_over_time(cloudflare_zone_requests{zone_id="<your-zone-id>"}[6h])
Use smoothing carefully and keep a raw panel nearby so you do not hide abrupt changes.
Dashboard Design Notes That Prevent Misreads
A few practical choices helped me avoid misreads:
- Put
requestsanduniqueson the same panel first, not separate rows. - Include
window_secondsin legend or panel description. - Pin timezone behavior so incident review matches your operational timezone conventions.
- Add a text panel reminding that uniques are per bucket and non-additive.
- Keep ratio panels adjacent to raw series panels.
Those small context hints saved me from future confusion more than once.
Where the Cache Fits Conceptually
Prometheus scraping can miss samples during restarts, pod evictions, network hiccups, or config rollouts.
The local SQLite cache allows the exporter to retain recent bucket history and replay it as explicit timestamped samples. That keeps visibility gaps smaller and preserves useful continuity for trend analysis.
I now think of this as a reliability layer between Cloudflare’s API and Prometheus TSDB, not just an implementation detail.
I will go deep into this in Part 2.
What This Architecture Gives You
With this model in place, what I get is:
- Cloudflare and custom metrics in one Prometheus query surface
- window-aware series that preserve meaning over time
- better incident timelines in Grafana
- safer overlap analysis for product and ops decisions
Most importantly, I avoid false confidence from misread charts.
For me, observability is only as useful as the semantics behind the numbers.
Next
Part 2 will focus on reliability engineering in the exporter:
- why delayed collection exists,
- why completed buckets are kept stable,
- how SQLite cache and replay protect against missed scrapes,
- and how backfill endpoints/jobs are used without corrupting interpretation.