Introduction
In Part 1, I focused on architecture and metric semantics. This part is about reliability, because that is where things usually get painful after the first dashboard looks good.
Reliability Changes Everything
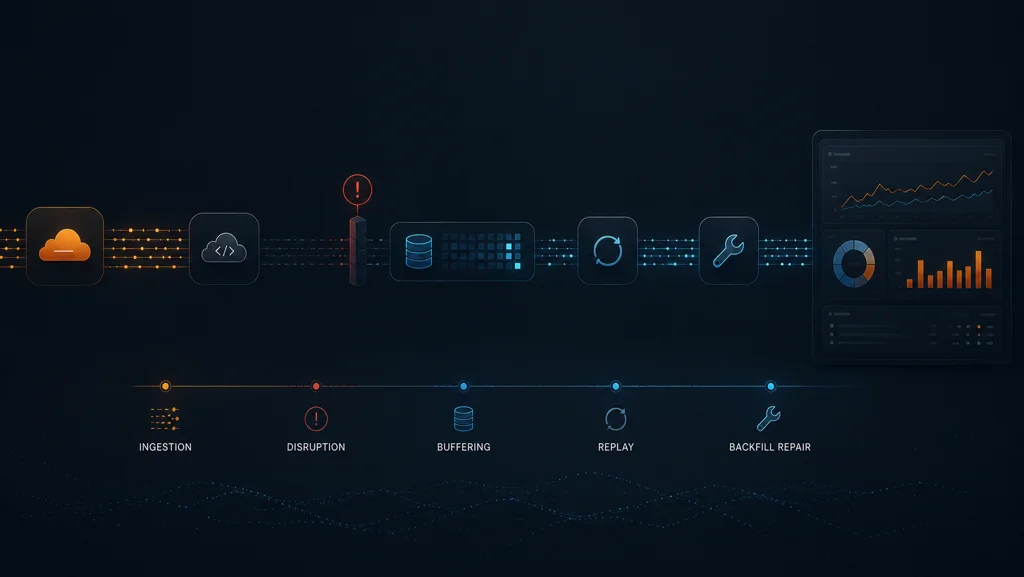
The first version of my pipeline worked, but it was fragile in exactly the ways that matter during incidents. Data sometimes arrived late, scrapes were occasionally missed, and short restarts created visibility gaps that were easy to ignore until I needed to debug something important. I learned quickly that having metrics is not the same as having trustworthy history.
Bucket Completeness and Delayed Collection
The first reliability issue was bucket completeness. Cloudflare analytics is bucketed, but bucket boundaries do not always mean instantly final values. If I queried too aggressively at the edge of a new window, I could fetch counts that were still settling. That led to one scrape showing a value and a later scrape showing a revised value for the same logical period, which made charts noisy and confidence lower.
My fix was simple and very effective: intentional delay. I query with an offset using CF_DELAY_SECONDS so I collect from a bucket that has had time to finalize. This means I am slightly behind real time, but the data is much more stable. In practice, that trade-off is absolutely worth it for operational dashboards.
delayed_now = datetime.now(timezone.utc) - timedelta(seconds=CF_DELAY_SECONDS)
bucket_end_timestamp = (int(delayed_now.timestamp()) // CF_BUCKET_SECONDS) * CF_BUCKET_SECONDS
end = datetime.fromtimestamp(bucket_end_timestamp, timezone.utc)
start = end - timedelta(seconds=CF_BUCKET_SECONDS)
Why I Keep Buckets Stable
The second reliability issue was historical drift. Even with delayed collection, there is still a design choice about whether already-collected windows should keep changing as new polls run. For this workflow, I chose stability. Once a completed bucket is captured, I keep it stable in the primary series path so historical interpretation remains consistent.
That decision made a bigger difference than I expected. It improved week-over-week comparisons, made deploy impact reviews cleaner, and reduced the amount of second-guessing when discussing traffic shifts. If historical points remain soft forever, the dashboard becomes harder to trust exactly when stakes are high.
# Keep a completed bucket immutable once first collected so Prometheus
# always sees one stable sample per Cloudflare bucket timestamp.
if cf_metrics["last_window_start_timestamp"] != window_start_timestamp:
cf_metrics["requests"] = request_count
cf_metrics["unique_visitors"] = unique_visitors
cf_metrics["last_window_start_timestamp"] = window_start_timestamp
cf_metrics["last_window_end_timestamp"] = window_end_timestamp
Scrape Gaps and Local Cache
The third reliability issue was scrape gaps. Prometheus is solid, but real systems still miss scrapes during rollouts, pod restarts, and short network interruptions. Without a resilience layer, those gaps become blind spots that distort trend analysis.
To address this, I persist recent Cloudflare buckets in a local SQLite cache inside the exporter runtime. I do not treat this cache as a TSDB replacement. I treat it as a short-term durability layer between upstream API collection and scrape ingestion. That gives me continuity through restarts, a cleaner recovery path after brief outages, and a safer way to repair missing windows.
with cf_cache_connect() as connection:
connection.execute(
"""
INSERT INTO cloudflare_hourly_cache (
window_start_timestamp,
window_end_timestamp,
requests,
unique_visitors,
collected_at_timestamp
) VALUES (?, ?, ?, ?, ?)
ON CONFLICT(window_start_timestamp) DO UPDATE SET
requests=excluded.requests,
unique_visitors=excluded.unique_visitors,
collected_at_timestamp=excluded.collected_at_timestamp
""",
(window_start_timestamp, window_end_timestamp, requests, unique_visitors, time.time()),
)
Replay and Backfill
From there, replay becomes practical. I expose a bounded recent replay window through /metrics using explicit timestamps so Prometheus can catch up automatically after temporary downtime. I keep this intentionally bounded with CF_METRICS_REPLAY_HOURS so the exporter does not over-emit historical samples and create unnecessary load.
for row in rows:
sample_timestamp_ms = row["window_start_timestamp"] * 1000
lines.append(
f'cloudflare_zone_requests{{{labels}}} {row["requests"]} {sample_timestamp_ms}'
)
lines.append(
f'cloudflare_zone_unique_visitors{{{labels}}} {row["unique_visitors"]} {sample_timestamp_ms}'
)
For larger holes or one-off repairs, I use explicit backfill workflows instead of expecting normal scrape behavior to fix everything. My pattern is straightforward: generate controlled backfill output from cache or source data, import with explicit timestamps, verify in Prometheus and Grafana, then remove temporary backfill artifacts. I treat this as maintenance work, not implicit background behavior, because explicit workflows stay auditable.
if parsed.path == "/cloudflare/backfill":
query = urllib.parse.parse_qs(parsed.query)
hours = int(query.get("hours", [str(CF_BACKFILL_MAX_HOURS)])[0])
step_seconds = int(query.get("step_seconds", [str(CF_COLLECTION_INTERVAL_SECONDS)])[0])
extend_to_now = query.get("extend_to_now", ["1"])[0] != "0"
body = cloudflare_backfill_text(hours, step_seconds, extend_to_now).encode()
Monitoring the Collector
I also monitor the exporter itself as a first-class component. Traffic metrics alone are not enough. I want to know collection success timing, collector duration, error accumulation, and cache window health so I can separate “traffic changed” from “collector reliability changed.” Those are two different operational questions and I need clear answers to both.
Kubernetes Guardrails
On Kubernetes, most of my early reliability pain was not about Cloudflare API correctness. It was about lifecycle and state. The setup became much steadier once I aligned readiness behavior with real collector health, ensured the cache path was persistent, kept resource limits conservative, and made scrape intervals explicit rather than assumed.
Trade-Offs
This does add complexity compared to a stateless API-to-metrics exporter. There is local state, replay logic, and backfill tooling to maintain. But the payoff is better continuity during outages, cleaner historical interpretation, and faster confidence during incident analysis. For my use case, that trade is worth it.
My Reliability Checklist
If I deploy this in a new environment, I now consider it incomplete until delayed collection is configured, cache durability is verified, replay windows are bounded, exporter health panels are visible, and the backfill path is tested before it is urgently needed.
Next
Part 3 will move into Kubernetes and Prometheus integration details, including deployment structure, Service and ServiceMonitor choices, scrape configuration patterns, and the operational decisions that keep this maintainable over time.