Introduction
In Part 1, I explained the metric semantics. In Part 2, I focused on reliability. In Part 3, I covered Kubernetes and scrape wiring.
This final part is where I actually use the data.
For me, the real value of this pipeline is not "Cloudflare in Grafana." The value is overlap analysis in one shared timeline, where traffic context and internal system behavior can be interpreted together.
Why Overlap Changed My Workflow
Before this setup, I was constantly switching tabs between Cloudflare analytics and internal dashboards. Even when timestamps seemed to match, context switching made investigation slower and made it easier to tell myself the wrong story.
Once I put both sides in Prometheus and visualized them together in Grafana, triage got more direct. I could see traffic shape and internal impact in one place without mentally stitching different tools together.
It did not magically solve root-cause analysis, but it made the first ten minutes of investigation much sharper.
The Core Panel: Requests and Unique Visitors Together
The panel I return to most is very simple. I plot cloudflare_zone_requests and cloudflare_zone_unique_visitors in the same time series chart for the same zone_id and window resolution.
This panel is not meant to answer everything. It is meant to show traffic shape changes early.
When requests rise faster than uniques, I read that as a potential change in request intensity per visitor. Sometimes that means crawl behavior, retries, bot pressure, or cache-related dynamics. When both rise together, I treat it as likely broad traffic growth. When uniques rise while requests stay relatively flat, I interpret that as wider but lighter traffic distribution.
Those are signals, not conclusions. The panel tells me where to look next.
Panel Config Snapshot
This panel configuration is the exact pattern I currently use in Grafana for Cloudflare overlap analysis.
The panel title is Cloudflare Traffic, with the description Request and unique visitors per hour. Both queries use Prometheus as the data source. Query A is cloudflare_zone_requests and Query B is cloudflare_zone_unique_visitors. I keep both as time series and render them together in one panel so I can see relationship shifts immediately instead of comparing separate charts.
The query options are intentionally constrained to keep the panel aligned to hourly semantics. In this setup, Max data points is 24, Min interval is 1h, and Interval is 1h. I also keep Relative time and Time shift at 1h in this panel context to align how I inspect recent window behavior.
Visually, I keep clear color separation between the two lines and use dual axes so requests and unique visitors remain readable together even when ranges differ. The goal is not visual polish. The goal is to detect shape changes fast and then verify impact in adjacent business and system panels.
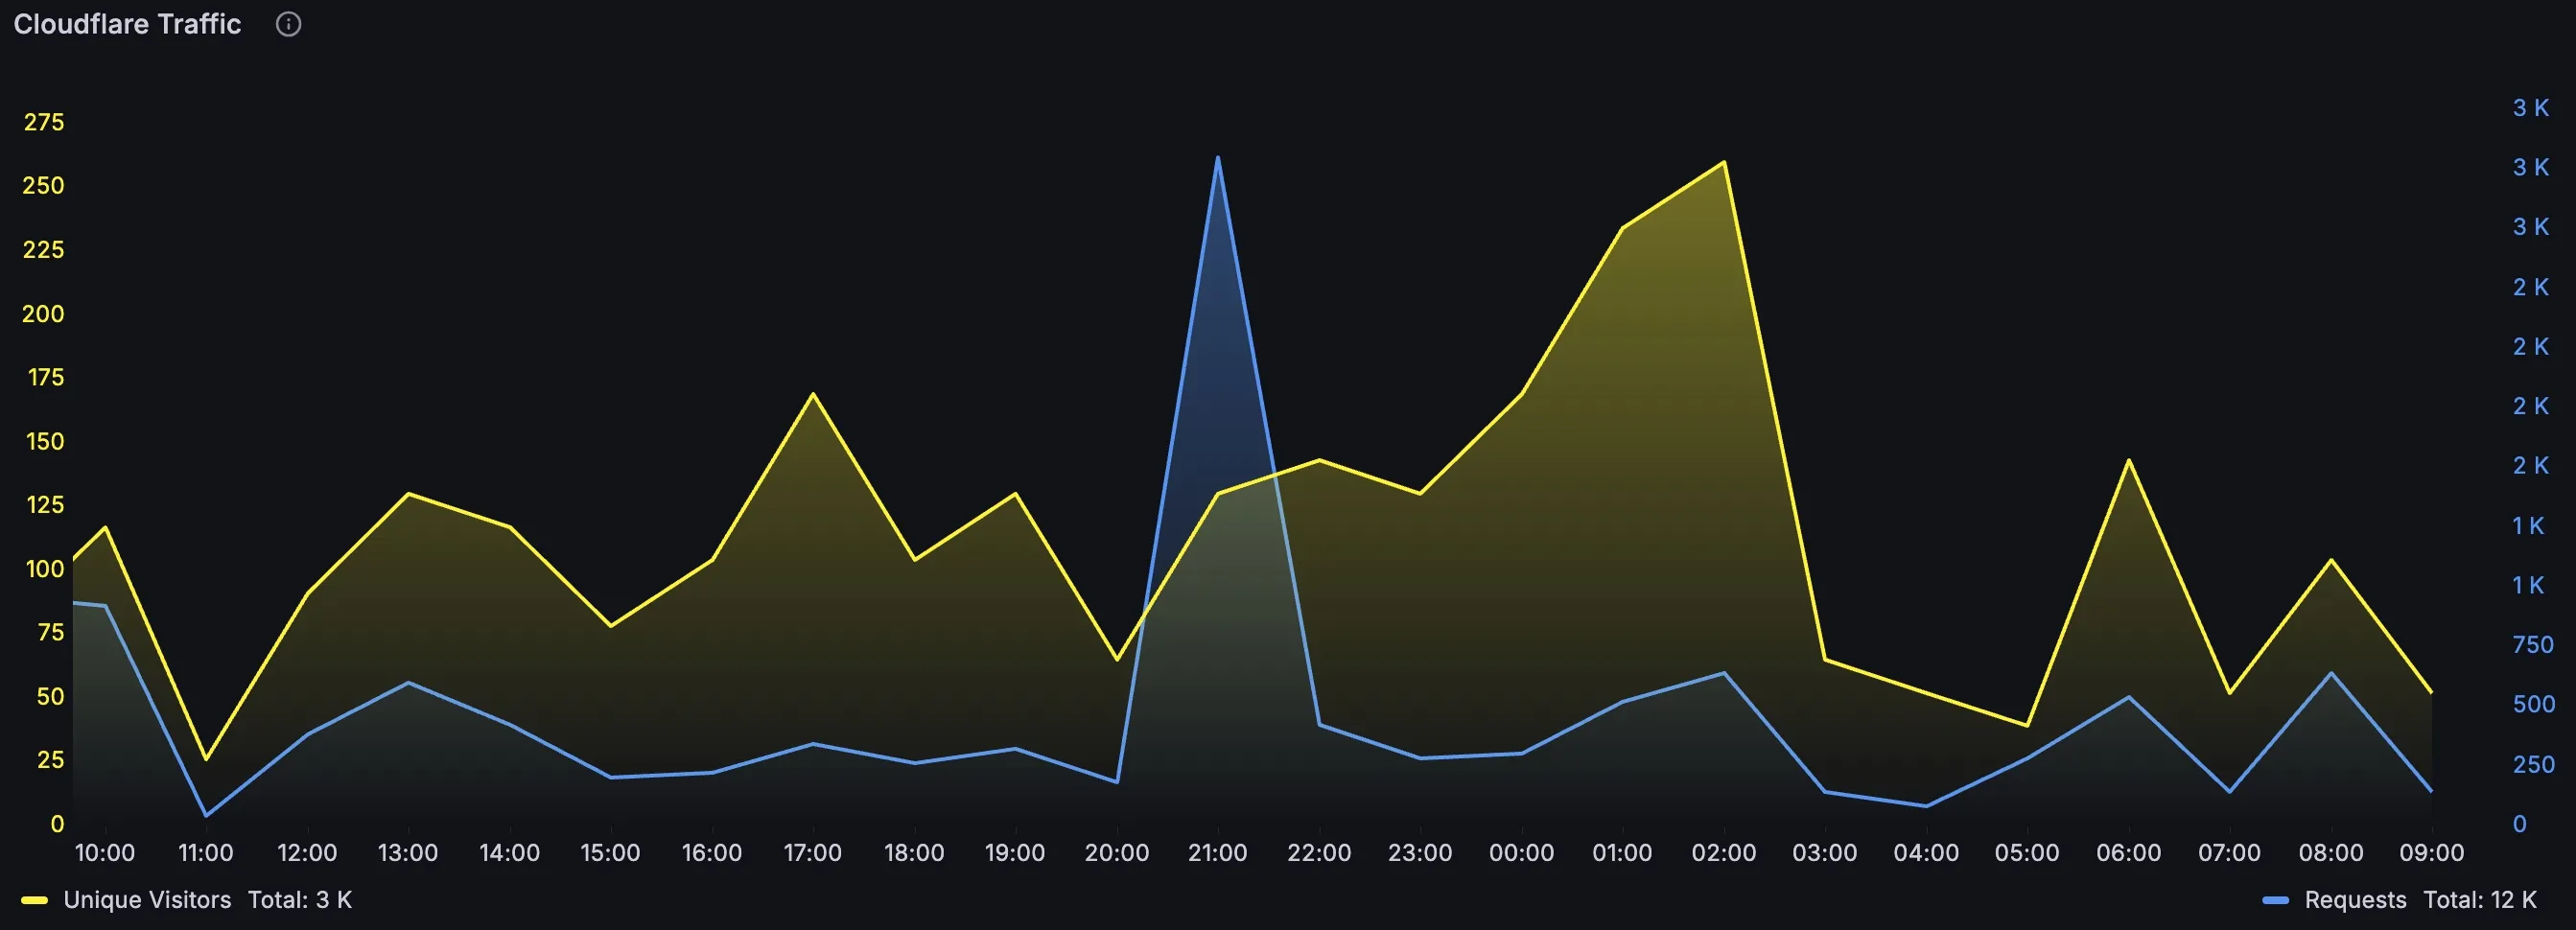 Legend: Overlapped Cloudflare Requests and Unique Visitors in one Grafana time series panel for fast shape comparison.
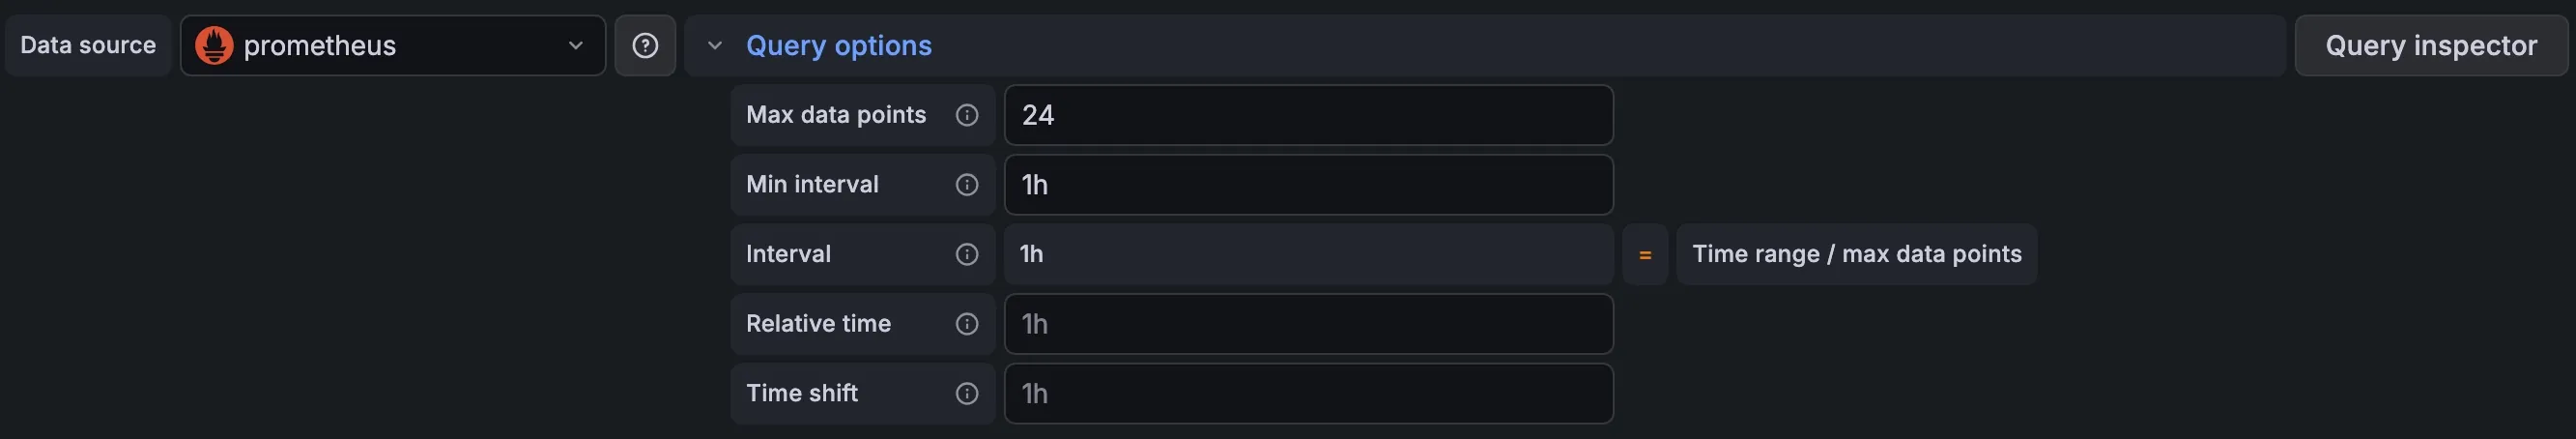 Legend: Query options pinned to hourly context (
Max data points: 24, Min interval: 1h, Interval: 1h) to match bucket semantics.
The Ratio Panel That Adds Fast Context
After the overlap panel, I use a requests-per-unique ratio view to quickly quantify shape shifts. This is especially useful when both lines are rising but at different slopes.
cloudflare_zone_requests{zone_id="<your-zone-id>"}
/
clamp_min(cloudflare_zone_unique_visitors{zone_id="<your-zone-id>"}, 1)
I keep this ratio close to the raw panel because ratio without raw context can be misleading.
The Most Important Semantic Guardrail
The single most important caveat never changed across this series: cloudflare_zone_unique_visitors is unique per bucket, not globally unique across arbitrary long periods.
I do not sum those values and call it absolute audience size. I use it for aligned trend and relationship analysis with requests.
That one discipline prevents a lot of bad decisions.
The Overlap Layout I Actually Use
My layout is intentionally practical. The top row shows Cloudflare requests and uniques together. Right beside it is the requests-per-unique ratio. Under those, I place custom business and system metrics that I care about during impact checks.
For business impact, I usually place conversion, signup, or checkout-related series. For system impact, I keep API latency, error rates, and queue or worker pressure visible. The point is to move from "traffic changed" to "did it matter?" without changing dashboards.
When I see a shape break in Cloudflare metrics, I scan down immediately. If errors jump at the same time, the story is different than when conversions hold steady.
Time Alignment Matters More Than Panel Styling
If time alignment is sloppy, overlap analysis falls apart.
I keep interval assumptions explicit and I avoid mixing incompatible resolutions in a way that visually implies precision that does not exist. If the Cloudflare bucket is hourly, I interpret it as hourly truth even if the dashboard redraws every few seconds.
I also keep timezone handling consistent across the dashboard so incident timelines map cleanly to logs, deploy markers, and team discussions.
How I Avoid Fooling Myself
There are three mistakes I actively avoid. The first is treating correlation as causation just because two lines move together. The second is trusting smoothed lines without checking raw shape. The third is using a ratio panel in isolation and forgetting its denominator behavior.
To stay honest, I keep raw Cloudflare series, ratio series, and at least one downstream business metric visible at the same time. If they disagree, I investigate deeper before drawing conclusions.
What This Looks Like During Real Incidents
In a typical regression check, I start at the overlap panel. If requests spike but uniques are flat, I immediately suspect request intensity dynamics and verify internal error, latency, and cache-related signals. If both traffic lines rise while conversion falls, I check funnel and backend behavior before assuming "bad traffic."
This workflow is not dramatic, but it is repeatable. Repeatable is what matters when multiple people need to reason about the same event quickly.
Closing the Series
This series started with one practical goal: unify Cloudflare and custom metrics so impact analysis gets faster and more reliable.
Part 1 defined metric meaning. Part 2 stabilized collection behavior. Part 3 made cluster operations predictable. Part 4 turned all of that into a decision-oriented dashboard flow.
The dashboard itself is not the product. The product is faster, clearer reasoning during changes and incidents.
That is what made this worth building.